Profit factor
Profit factor — Gross profit divided by gross loss — how many currency units you made for every one you lost.
Profit factor is the first number most traders look at and the one most likely to be misread. It is a ratio of totals, and totals hide almost everything about how you got there.
In plain English
Add up every winning trade. Add up every losing trade, ignoring the minus sign. Divide the first by the second. That is profit factor. A profit factor of 1.58 means that across the whole period, every $1.00 you lost was matched by $1.58 you made.
Anything above 1.0 means the period ended in profit; anything below it means you finished down. The distance from 1.0 is the interesting part. 1.05 is a period that was very nearly flat and would have been negative on slightly worse fills. 2.0 is a genuinely strong period.
The reason it gets quoted so much is that it is scale-free. It does not care whether you trade 0.01 lots or 10, whether your account is $500 or $500,000, or how many trades you took. That makes it the easiest metric to compare across accounts — and it is also exactly why it is easy to over-read.
The formula
Profit factor = gross profit ÷ |gross loss|
- Gross profit — the sum of every trade with a positive net result.
- Gross loss — the sum of every trade with a negative net result, as an absolute value.
- Both are net of commission and swap, because those are money that left the account.
If you had no losing trades at all, the denominator is zero and the ratio is undefined. TapeSheet shows ∞ rather than inventing a number.
Worked example — the demo account
The bundled demo account: 96 closed trades between 6 January 2025 and 9 April 2025.
| Gross profit (49 winners) | $11,692.91 | |
|---|---|---|
| Gross loss (47 losers) | −$7,399.46 | |
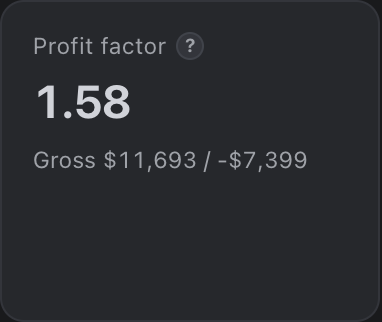
| Profit factor | 1.58 | 11,692.91 ÷ 7,399.46 |
A profit factor of 1.58. Over 96 trades, each dollar lost bought $1.58 of profit.
That is a respectable but not remarkable number, and the honest reading of it is: this account has an edge, and the edge is not large enough to survive much widening of costs. Commission on those 96 trades came to −$329.04. Double the commission and the profit factor falls to roughly 1.51 — still positive. Add a spread cost of $30 per trade and it goes underwater.
That sensitivity is the number worth knowing, and it is not visible in the ratio itself.
Every figure above is from the demo account TapeSheet ships with — 96 closed trades, generated from a fixed seed. Open the same account →
What this does not tell you
The caveat is the part worth reading. Most tools put it in a footer, if they print it at all.
- Nothing about the order. A profit factor of 1.58 built from a steady grind and one built from a single enormous winner inside a long losing run are the same number. The second account is far more likely to blow up, and profit factor cannot see the difference. Read it beside maximum drawdown, always.
- Nothing about sample size. Six trades can produce a profit factor of 3.0 by luck. The ratio carries no confidence interval and does not get less confident when the sample is tiny.
- Nothing about how the money was made. A high profit factor from one outlier is fragile; remove the single best trade from this demo account and the profit factor drops from 1.58 to 1.48. If removing one trade moves your number a lot, the number is describing that trade, not your method.
- Nothing about risk taken. Two accounts with identical profit factors can be running one at 0.5% risk per trade and the other at 8%. Only one of them will still exist next year.
Where TapeSheet shows it
The Profit factor tile on the Overview, with gross profit and gross loss printed beneath it. It is also the joint-heaviest input to the Tape Score, at 20% of the composite.
Questions
What is a good profit factor?
There is no threshold that means anything on its own. Above 1.0 is profitable, and beyond that the useful question is how the number was built — over how many trades, with what drawdown, and whether it survives removing your single best trade. A profit factor of 1.3 across 500 trades with a 6% drawdown describes a better system than 2.5 across 20 trades with a 40% drawdown.
Does profit factor include commission and swap?
In TapeSheet, yes. Both totals are net of commission, swap and any fees the statement records, because that is money that actually left the account. Some tools compute it on gross profit before costs, which flatters the number — if you are comparing a figure from elsewhere, check which one it is.
Related terms
See your own statement, analyzed
Drop an MT4 or MT5 statement on the page and the whole dashboard renders in about three seconds. No signup, no upload — the file is parsed inside your browser tab and never leaves your device.
Analyze my statementAll glossary terms ·Free trading journal ·MT4 statement analyzer ·MT5 report analyzer