Home Glossary SQN (System Quality Number)
SQN (System Quality Number)
SQN (System Quality Number) — Van Tharp’s measure of system quality: mean result divided by the standard deviation of results, multiplied by the square root of the number of trades.
SQN is the most defensible single-number summary of a trading record, because it is the only common one that gets less confident when your sample is small.
In plain English
Van Tharp’s System Quality Number takes the average result of your trades, divides it by how much those results vary, and multiplies by the square root of how many trades there were. The three parts map onto the three questions you actually have: is there an edge, is it consistent, and have you seen enough trades to believe it?
That third term is what makes it worth using. Ten profitable trades and four hundred profitable trades with identical averages produce very different SQNs, because √400 is six times √10. Nearly every other metric in a statement treats those two records as equivalent.
Tharp’s original formulation works in R-multiples rather than currency, and caps the trade count at 100 so that a long record cannot inflate the score indefinitely. Both details matter if you are comparing your number against his published bands.
The formula
SQN = (mean trade result ÷ standard deviation of trade results) × √N
- N is the number of trades — capped at 100 in Tharp’s original definition.
- Tharp computes the mean and deviation on R-multiples; in currency the ratio is unchanged only if every trade risked the same amount.
- The mean-over-deviation part alone is sometimes called the “edge ratio”.
Tharp’s bands, for reference: below 1.6 poor · 1.6–1.9 below average · 2.0–2.4 average · 2.5–2.9 good · 3.0–5.0 excellent · above 5.0 exceptional and worth double-checking your data.
Worked example — the demo account
Worked by hand on the demo account, in currency, using the population standard deviation the dashboard reports:
| Mean trade result (expectancy) | +$44.72 | |
|---|---|---|
| Standard deviation per trade | $240.49 | |
| Edge ratio | 0.186 | 44.72 ÷ 240.49 |
| Trades | 96 | |
| SQN | 1.82 | 0.186 × √96 |
An SQN of 1.82 — “below average” on Tharp’s scale, and a fair description of the account.
The edge ratio is the sobering part. At 0.186, the average trade is worth about a fifth of one standard deviation, which means the distribution of outcomes is enormously wider than the edge inside it. Across 96 trades that edge accumulates into +$4,293.45; across any ten trades it is invisible, and a losing month is entirely ordinary rather than evidence of anything.
Note also that this figure is in currency, not R. The demo account varies its position size between 0.05 and 0.90 lots, so part of the standard deviation above is position-sizing variation rather than system variation. Computed in R it would be different — and probably better, which is precisely why Tharp specifies R.
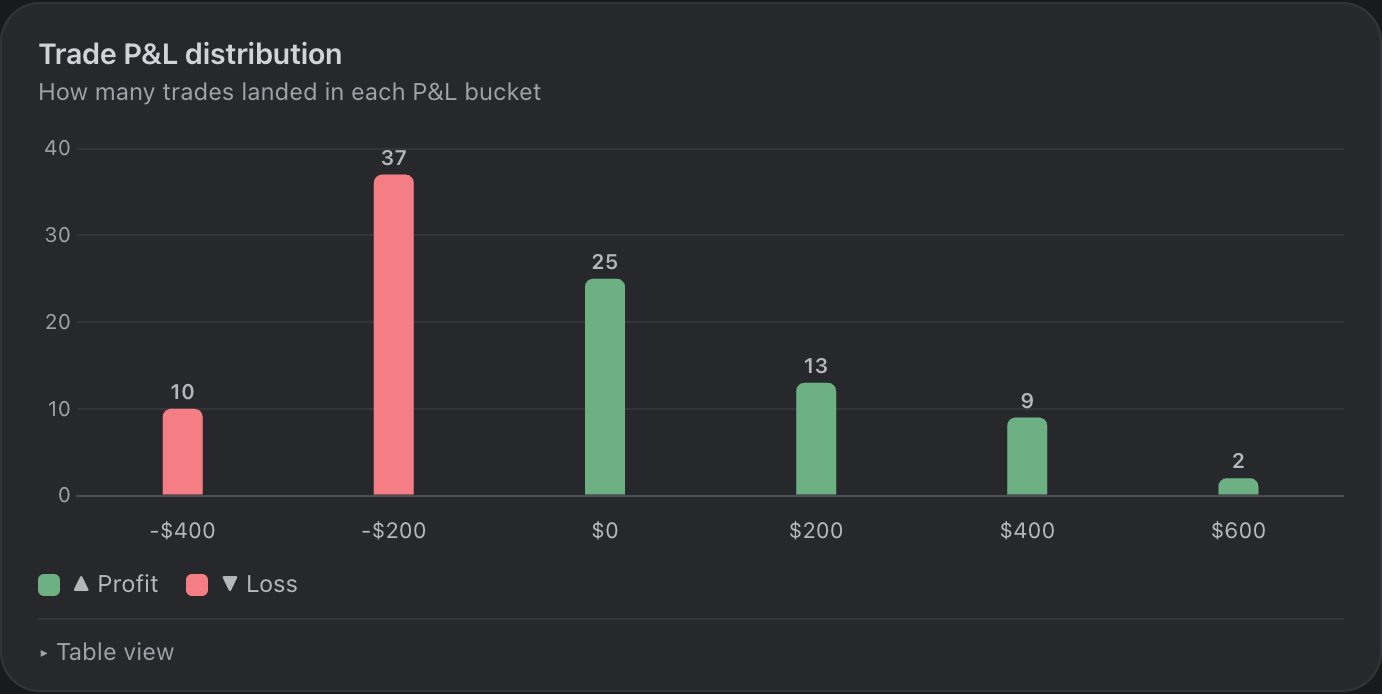
Every figure above is from the demo account TapeSheet ships with — 96 closed trades, generated from a fixed seed. Open the same account →
What this does not tell you
The caveat is the part worth reading. Most tools put it in a footer, if they print it at all.
- It assumes your trades are independent and identically distributed. They are not. Revenge trading, size increases after a win and a change of market regime all break the assumption, and the number carries on being computed regardless.
- In currency it double-counts position sizing. A record with varying lot sizes has a standard deviation inflated by the sizing, which depresses SQN for reasons that have nothing to do with system quality. Compute it in R if you can.
- The bands are a convention, not a law. They come from one author’s experience and are widely quoted without their original context. Treat them as a rough vocabulary, not a grade.
- A high SQN can still be a system you cannot trade. It says nothing about drawdown depth or how long you would spend underwater.
- The √N term rewards trade frequency. Two systems with the same edge ratio score differently purely because one trades more often, and more trades also means more costs.
Where TapeSheet shows it
Not displayed. TapeSheet shows the two ingredients separately — expectancy, and standard deviation per trade and per day — because they are individually meaningful and the composite is not obviously more useful than the pair. If you want your SQN, both numbers are on the Overview and the arithmetic is one line. The composite TapeSheet does publish, with all of its weights, is the Tape Score.
Related terms
See your own statement, analyzed
Drop an MT4 or MT5 statement on the page and the whole dashboard renders in about three seconds. No signup, no upload — the file is parsed inside your browser tab and never leaves your device.
Analyze my statementAll glossary terms ·Free trading journal ·MT4 statement analyzer ·MT5 report analyzer