Sharpe ratio
Sharpe ratio — Return per unit of volatility — excess return divided by the standard deviation of returns, usually annualised.
Sharpe is the standard risk-adjusted return measure in fund management, and applying it to a retail broker statement produces numbers that are not merely imprecise but actively misleading. TapeSheet does not show it. Here is the arithmetic, and here is why.
In plain English
The Sharpe ratio asks how much return you earned for each unit of volatility you endured. Take a series of periodic returns, subtract the risk-free rate, divide the mean by the standard deviation, and scale to a year. A fund with a Sharpe of 1.0 is respectable; 2.0 is excellent; above 3.0, in a fund context, invites scrutiny rather than applause.
It was designed for a portfolio marked to market at the close of every day, over years, with a well-defined risk-free alternative. Every one of those conditions fails for a trading statement, and each failure pushes the number in the same direction: up.
The result is that a Sharpe ratio computed from an MT4 or MT5 statement is not a smaller-sample version of a fund Sharpe. It is a different quantity that happens to share a name, and comparing yours against a published fund figure is meaningless in both directions.
The formula
Sharpe = (mean periodic return − risk-free rate) ÷ standard deviation of periodic returns × √(periods per year)
- For a daily series, periods per year is conventionally 252 trading days.
- The risk-free rate is the return you could have had for no risk; at retail scale it is normally taken as zero, which inflates the result.
- The standard deviation must be of the same return series, over the same periods.
Substituting per-trade results for periodic returns — which is what most trading tools do — is not the Sharpe ratio. It answers a different question and is closer to SQN.
Worked example — the demo account
Worked by hand on the demo account, treating each of the 51 trading days as one period and returns as a share of the balance at the start of that day:
| Trading days with at least one closed trade | 51 | |
|---|---|---|
| Mean daily return | 0.271% | |
| Standard deviation of daily returns | 0.886% | |
| Risk-free rate assumed | 0% | |
| Annualised Sharpe | 4.83 | 0.271 ÷ 0.886 × √252 |
An annualised Sharpe of 4.83 — a figure that would place this account among the best-performing funds in the world. It is nonsense, and every reason why is listed below.
This is the most useful thing on the page. The account is decent: a profit factor of 1.58, a 10.97% drawdown, a Tape Score of 58 out of 100. It is not a world-class fund. The metric produced a spectacular number from an ordinary account, and it did so for structural reasons rather than by chance.
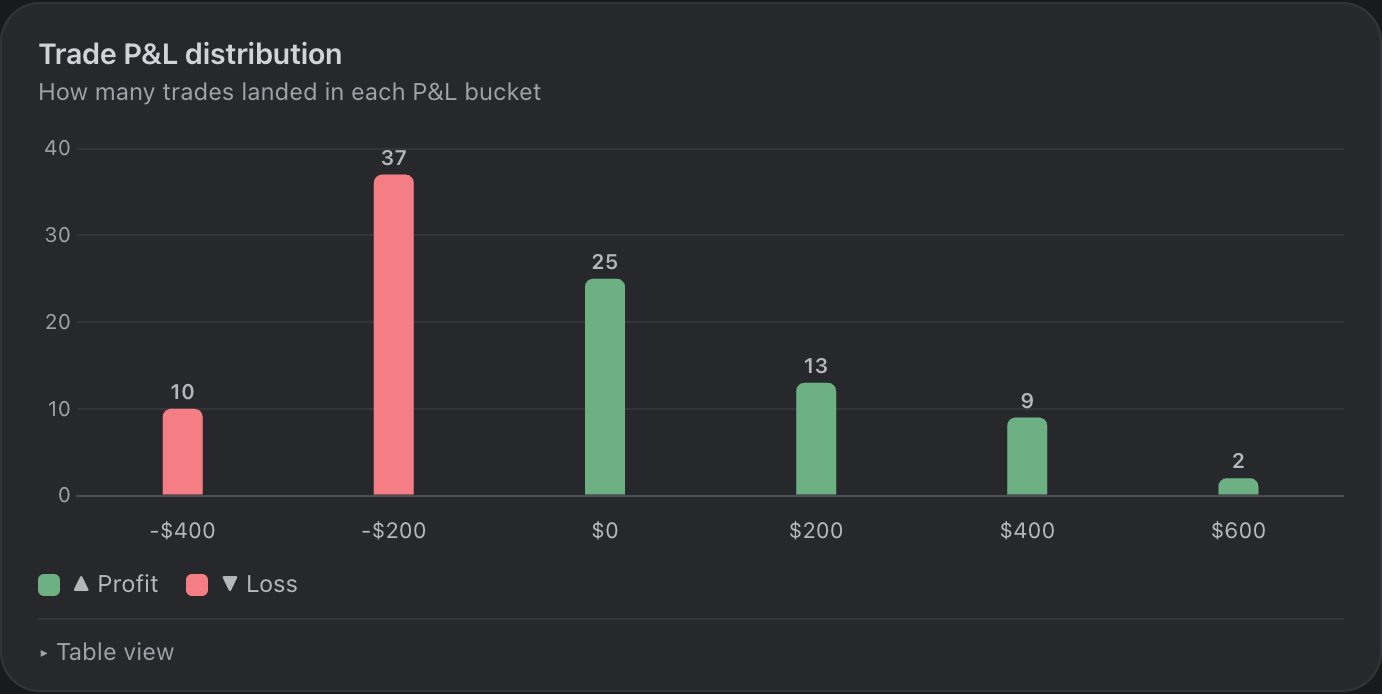
Every figure above is from the demo account TapeSheet ships with — 96 closed trades, generated from a fixed seed. Open the same account →
What this does not tell you
The caveat is the part worth reading. Most tools put it in a footer, if they print it at all.
- Only days you traded are counted. 51 trading days across 93 calendar days means 42 days of zero variance were silently dropped. Including them lowers the mean and the deviation unevenly and changes the answer materially. There is no correct convention here, which is a bad sign for a metric.
- Balance-based returns understate volatility badly. A statement records a trade at close. Every intraday excursion — the part that is the volatility — is invisible. The denominator is too small, so the ratio is too big. This is the same defect that makes balance-based drawdown understate the real one, and it hits Sharpe harder.
- Ninety-three days annualised by √252 is an extrapolation, not a measurement. One quarter is being asserted to represent a year.
- It punishes upside volatility identically to downside. A trader with occasional very large winners is penalised for them. This is the standard critique and the reason the Sortino ratio exists.
- A zero risk-free rate flatters the number, and using a real one at retail scale is arguably wrong too, since a margin account is not a portfolio you could have invested in bills instead.
Where TapeSheet shows it
Nowhere, on purpose. TapeSheet does not display a Sharpe ratio, because on statement data it cannot be computed honestly and a number this easy to misread does more harm than the space it would fill. What the dashboard shows instead is the thing Sharpe is a proxy for: the full P&L distribution, the standard deviation per trade ($240.49 on the demo account) and per day ($278.76), the underwater chart, and drawdown. If you need a single risk-adjusted figure from a statement, SQN is the more defensible one.
Questions
Will TapeSheet ever add a Sharpe ratio?
Only if it can be shown with the convention it used and a caveat attached, the way drawdown is. The number itself is easy to compute; the difficulty is that a single figure with no context invites exactly the comparison it cannot survive. If you want it for a specific reason, the contact page is open.
What about the Sortino or Calmar ratio?
Sortino has the same input problem — it needs a return series that a closed-trade statement does not contain. Calmar is return over maximum drawdown, and TapeSheet does show that under its trading name: recovery factor, on the Overview. It is 1.43 on the demo account.
Related terms
See your own statement, analyzed
Drop an MT4 or MT5 statement on the page and the whole dashboard renders in about three seconds. No signup, no upload — the file is parsed inside your browser tab and never leaves your device.
Analyze my statementAll glossary terms ·Free trading journal ·MT4 statement analyzer ·MT5 report analyzer